Using Phase Contrast Images
Phase contrast images give an image where the brightness of the pixel is proportional to the velocity of the blood at that point. By integrating the pixel velocities over the area of the blood vessel (and knowing how thick the slice is), you can calculate the volume flow of blood through the blood vessel. As the user, you choose the slice so that it is perpendicular to the vessel you want to measure flow through. After the image is acquired, you also have to define the contours of the vessel so the computer knows which pixels to analyze.
Uses for Volume Information
Confirming the left and right ventricular stroke volumes as calculated by the Simpson’s rule volumetric technique (i.e. drawing circles).
The blood flow through the proximal aorta should equal the left ventricular stroke volume. The blood flow through the pulmonary artery should equal the right ventricular stroke volume. This will not be true if there is tricuspid regurgitation, mitral regurgitation, or a ventricular septal defect.
Measuring aortic insufficiency
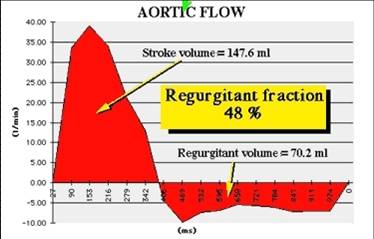
Obtaining a phase contrast measurement through the proximal aorta allows you to calculate the flow through this slice throughout the cardiac cycle. Portions of the graph above the zeroline represent forward flow. Portions of the graph below the zeroline represent retrograde, or regurgitant flow. Actually, some of this regurgitant flow supplies the coronary arteries, but this is neglected when providing measurements. The NET flow (i.e. the area above the zeroline minus the area under the zeroline) is called Qs and represents the total amount of systemic flow per heartbeart.
Measuring pulmonary insufficiency.
Similar to measuring aortic insufficiency, obtaining a phase contrast measurement through the proximal pulmonary artery allows you to display the flow through this slice throughout the cardiac cycle. Portions of the graph above the zeroline represent forward flow. Portions of the graph below the zeroline represent retrograde, or regurgitant flow. The NET flow (i.e. the area above the zeroline minus the area under the zeroline) is called Qp and represents the total amount of pulmonic flow per heartbeart. This is an important measurement to make in congential heart disease cases since most pulmonary artery conduits are valveless and have free regurgitation which worsens with time.
Measuring mitral regurgitation.
The left ventricular stroke volume measured via the Simpsons rule circles represents the total amount of blood exiting the left ventricle during systole. This stroke volume equals the volume of forward aortic flow plus the volume of mitral regurgitation. When the stroke volume is greater than the forward aortic flow as measured by phase contrast, the difference is the volume of mitral regurgitation. This will not work when the patient has mitral regurgitation AND a ventricular septal defect. In this case, stroke volume equals the volume of forward aortic flow plus the volume of mitral regurgitation plus the volume of the ventricular septal defect. You must first calculate the volume of the VSD as discussed below.
Measuring tricuspid regurgitation.
This is similar to measuring mitral regurgitation. The right ventricular stroke volume measured via the Simpsons rule circles represents the total amount of blood exiting the right ventricle during systole. This stroke volume equals the volume of forward pulmonary flow plus the volume of tricuspid regurgitation. When the stroke volume is greater than the forward pulmonary flow as measured by phase contrast, the difference is the volume of tricuspid regurgitation. This will not work when the patient has tricuspid regurgitation AND a ventricular septal defect. In this case it is not so easy to calculate the volume of tricuspid regurgitation.
Calculating the volume of a VSD
In the absence of a shunt, Qp = Qs. When there is a left to right shunt some of the blood from the left ventricle passes into the right heart and becomes part of the pulmonary circulation and Qp > Qs. The difference is the volume of the shunt. If the shunt is a VSD then you can calculate the volume and use it help calculate mitral and tricuspid regurgitant values.
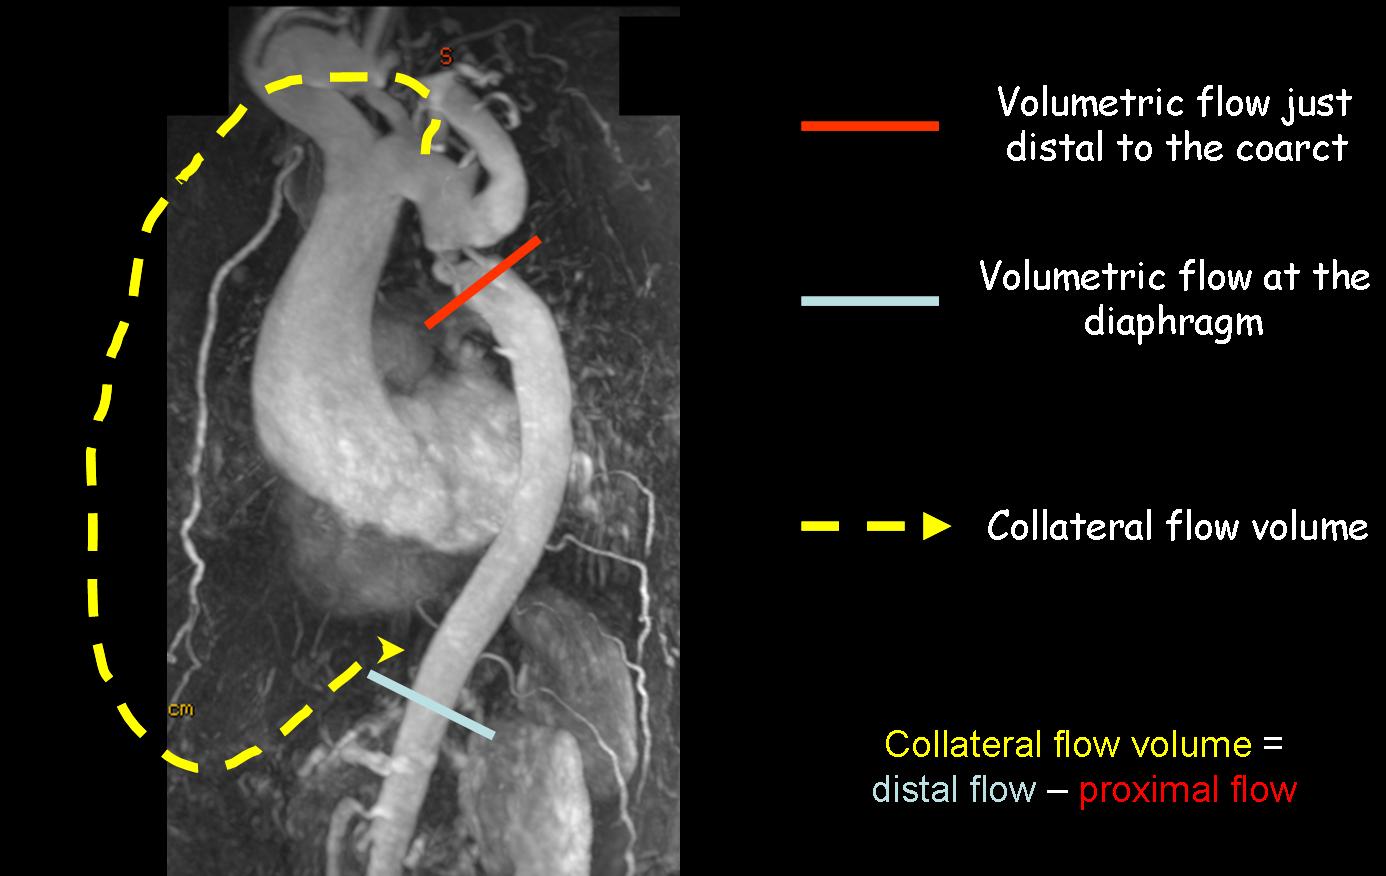
Calculating collateral flow around an aortic coarctation.
Blood detours around an aortic coarctation by flowing retrograde through the intercostal arteries and back into the descending thoracic aorta. Measure the volume flow immediately distal to the coarctation and then again at the diaphragms. The difference between these values is the amount of blood that bypassed the coarctation via collaterals.